
Graphing the P&L from a strategy
By Mukul Pareek
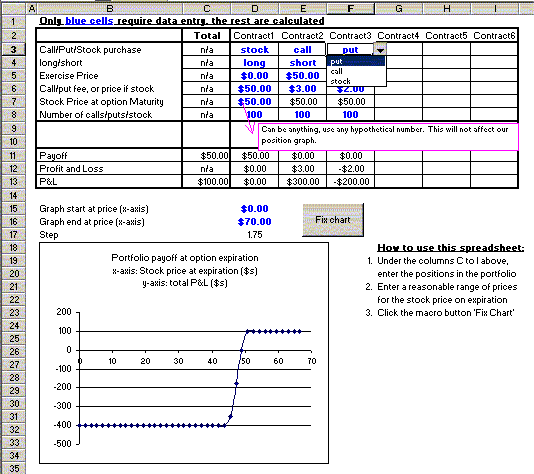
Using this spreadsheet, you can check out what a straddle, a butterfly and a bull spread means, play with synthetics - you enter the options positions on the top and at the bottom you get to see the P&L graph resulting from the position. But remember - this is not a valuation model - the graph shows the P&L if the options are held to expiration.
Also, I have provided space for 6 positions, which was sufficient for me, and one can select long and short positions in stocks, calls and puts.
The spreadsheet can be downloaded here, and is completely unprotected so you can modify it to fit your needs.
Here is a screenshot of the model:
The way this article is presented has me interested. This essay is really beneficial to us. Keep posting, Thank youopen interest in trading
ReplyDeleteGraphing a P&L for an options portfolio is essential for tracking performance. An Options Trading Seminar and Master Class can teach traders to analyze and visualize data effectively, ensuring better decision-making.
ReplyDelete